Example 3-5 provides source code for the stock monitoring application with three series of data. In addition to the series used in Example 3-4, the previous example, two new series are declared.
The series are assigned to the chart by using consecutive calls of the getData and addAll methods.
| Example 3-5 Adding Two More Series to the Stock Monitoring Sample
import javafx.application.Application;
import javafx.scene.Scene;
import javafx.scene.chart.CategoryAxis;
import javafx.scene.chart.LineChart;
import javafx.scene.chart.NumberAxis;
import javafx.scene.chart.XYChart;
import javafx.stage.Stage;
public class LineChartSample extends Application {
@Override public void start(Stage stage) {
stage.setTitle("Line Chart Sample");
final CategoryAxis xAxis = new CategoryAxis();
final NumberAxis yAxis = new NumberAxis();
xAxis.setLabel("Month");
final LineChart<String,Number> lineChart =
new LineChart<String,Number>(xAxis,yAxis);
lineChart.setTitle("Stock Monitoring, 2010");
XYChart.Series series1 = new XYChart.Series();
series1.setName("Portfolio 1");
series1.getData().add(new XYChart.Data("Jan", 23));
series1.getData().add(new XYChart.Data("Feb", 14));
series1.getData().add(new XYChart.Data("Mar", 15));
series1.getData().add(new XYChart.Data("Apr", 24));
series1.getData().add(new XYChart.Data("May", 34));
series1.getData().add(new XYChart.Data("Jun", 36));
series1.getData().add(new XYChart.Data("Jul", 22));
series1.getData().add(new XYChart.Data("Aug", 45));
series1.getData().add(new XYChart.Data("Sep", 43));
series1.getData().add(new XYChart.Data("Oct", 17));
series1.getData().add(new XYChart.Data("Nov", 29));
series1.getData().add(new XYChart.Data("Dec", 25));
XYChart.Series series2 = new XYChart.Series();
series2.setName("Portfolio 2");
series2.getData().add(new XYChart.Data("Jan", 33));
series2.getData().add(new XYChart.Data("Feb", 34));
series2.getData().add(new XYChart.Data("Mar", 25));
series2.getData().add(new XYChart.Data("Apr", 44));
series2.getData().add(new XYChart.Data("May", 39));
series2.getData().add(new XYChart.Data("Jun", 16));
series2.getData().add(new XYChart.Data("Jul", 55));
series2.getData().add(new XYChart.Data("Aug", 54));
series2.getData().add(new XYChart.Data("Sep", 48));
series2.getData().add(new XYChart.Data("Oct", 27));
series2.getData().add(new XYChart.Data("Nov", 37));
series2.getData().add(new XYChart.Data("Dec", 29));
XYChart.Series series3 = new XYChart.Series();
series3.setName("Portfolio 3");
series3.getData().add(new XYChart.Data("Jan", 44));
series3.getData().add(new XYChart.Data("Feb", 35));
series3.getData().add(new XYChart.Data("Mar", 36));
series3.getData().add(new XYChart.Data("Apr", 33));
series3.getData().add(new XYChart.Data("May", 31));
series3.getData().add(new XYChart.Data("Jun", 26));
series3.getData().add(new XYChart.Data("Jul", 22));
series3.getData().add(new XYChart.Data("Aug", 25));
series3.getData().add(new XYChart.Data("Sep", 43));
series3.getData().add(new XYChart.Data("Oct", 44));
series3.getData().add(new XYChart.Data("Nov", 45));
series3.getData().add(new XYChart.Data("Dec", 44));
Scene scene = new Scene(lineChart,800,600);
lineChart.getData().addAll(series1, series2, series3);
stage.setScene(scene);
stage.show();
}
public static void main(String[] args) {
launch(args);
}
}
|
Each series of data has its unique name defined by using the setName method.
The result of compiling and running this application is shown in Figure 3-4.
Figure 3-4 Stock Monitoring Example with Tree Series of Data
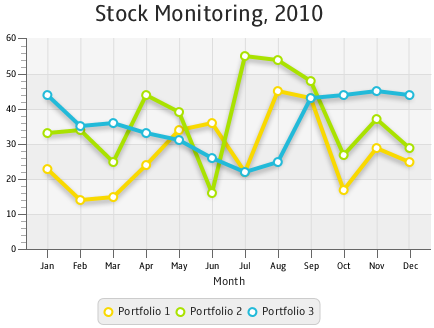
Description of "Figure 3-4 Stock Monitoring Example with Tree Series of Data"
Note that the different colors of the lines are defined by the declared order of the corresponding series in the addAll method. Change the order as follows: lineChart.getData().addAll(series3, series1, series2), and then compile and run the application. The modified output is shown in Figure 3-5.