
История развития хранилищ для нефти: Первые склады нефти появились в XVII веке. Они представляли собой землянные ямы-амбара глубиной 4…5 м...
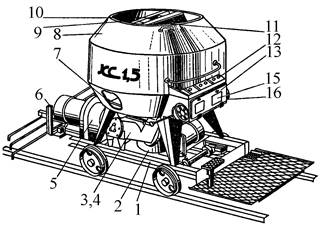
Кормораздатчик мобильный электрифицированный: схема и процесс работы устройства...
История развития хранилищ для нефти: Первые склады нефти появились в XVII веке. Они представляли собой землянные ямы-амбара глубиной 4…5 м...
Кормораздатчик мобильный электрифицированный: схема и процесс работы устройства...
Топ:
Характеристика АТП и сварочно-жестяницкого участка: Транспорт в настоящее время является одной из важнейших отраслей народного...
Оценка эффективности инструментов коммуникационной политики: Внешние коммуникации - обмен информацией между организацией и её внешней средой...
Интересное:
Искусственное повышение поверхности территории: Варианты искусственного повышения поверхности территории необходимо выбирать на основе анализа следующих характеристик защищаемой территории...
Принципы управления денежными потоками: одним из методов контроля за состоянием денежной наличности является...
Подходы к решению темы фильма: Существует три основных типа исторического фильма, имеющих между собой много общего...
Дисциплины:
|
из
5.00
|
Заказать работу |
Содержание книги
Поиск на нашем сайте
|
|
|
|
The principle of practical confidence: If the probability of an event A in a given trial is very small, one can be confident at a single realization of the trial that the event A will not take place, and in practical activities one should behave as if the event A is impossible in general.
Testing of statistical hypotheses is closely connected to the theory of statistical estimation of parameters. It is used every time when it is necessary the substantiated conclusion on advantages of this or that way of investments, measurements, shooting, technological process, about efficiency of a new method of training, management, on benefit of brought fertilizer, medicine, on a level of profitableness of securities, on importance of a mathematical model, etc.
Any assumption on a kind or parameters of an unknown law of distribution is said to be a statistical hypothesis.
One distinguishes simple and complex statistical hypotheses. A simple hypothesis in contrast to complex completely determines the theoretical function of distribution of a random variable. For example, hypotheses «the probability of occurrence of the event in Bernoulli circuit is equal to 1/2», «the law of distribution of a random variable is normal with parameters a = 0, s 2 = 1» are simple, and hypotheses «the probability of occurrence of the event in Bernoulli circuit is enclosed between 0,3 and 0,6», «the law of distribution is not normal» are complex.
Tested hypothesis is usually called null (or basic) hypothesis and is denoted by H 0. Alongside with a null hypothesis H 0 one considers alternative or competing hypothesis being logic denying of H 0. Null and alternative hypotheses represent two opportunities of the choice which is carried out in problems of testing of statistical hypotheses.
The essence of testing of a statistical hypothesis is that a specially composed sampling characteristic (statistics)  received on sample X 1, X 2, …, Xn is used, of which exact or approximate distribution is known. Then on this sampling distribution a critical value qcr is determined – such that if the hypothesis H 0 is true, the probability
  is small; so in according to the principle of practical confidence in conditions of the given investigation the event
  can be considered (with some risk) as practically impossible. Therefore if in the given concrete case the deviation holds then the hypothesis H 0 is rejected, and if appearance of the value
  is considered compatible with the hypothesis H 0 then the hypothesis H 0 is accepted (more precisely, is not rejected). The rule, by which the hypothesis H 0 is rejected or accepted, is said to be a statistical criterion or statistical test.
Thus, the set of possible values of statistics of criterion (critical statistics)  is partitioned into two disjoint subsets: critical area (area of rejection of the hypothesis) W and area of allowable values (area of acceptance of the hypothesis)
  . If actually observable value of statistics of criterion
  gets in critical area W, the hypothesis H0 is rejected. Thus, four cases are possible:
| The hypothesis H0 | It is accepted | It is rejected |
| True | The correct decision | Mistake of the 1st sort |
| False | Mistake of the 2nd sort | The correct decision |
Probability a to make a mistake of the 1st sort, i.e. to reject the hypothesis H0 when it is true, is said to be a significance level (or a size) of criterion.
Probability 1– a not to make a mistake of the 1st sort, i.e. to accept the hypothesis H0 when it is true, sometimes name the operative characteristic of criterion.
Probability to make a mistake of the 2nd sort, i.e. to accept the hypothesis H0 when it is false, is usually denoted by b.
Probability 1 – b not to make a mistake of the 2nd sort, i.e. to reject the hypothesis H0 when it is false, is said to be power (or power function) of criterion.
Using terminology of statistical control of production quality, it is possible to tell that probability a represents «risk of the supplier» connected with rejection by results of sampling control of products of all party satisfying the standard, and probability b – «risk of the consumer» connected to acceptance under the analysis of sample of the party which are not satisfying the standard.
Applying the juridical terminology, a – probability of giving out by court of a verdict of guilty when actually an accused is innocent, b – probability of giving out by court of a verdict of "not guilty" when actually an accused is guilty in fulfillment of a crime. In a number of applied researches a mistake of the first sort a means probability of that a signal intending to the observer will not be accepted, and a mistake of the second sort b – probability of that the observer will accept a false signal.
Probabilities of mistakes of the 1st and 2nd sort (a and b) are uniquely determined by a choice of critical area. Obviously, it is desirable to make somehow small a and b. However it is inconsistent requirements: at the fixed volume of sample it is possible to make somehow small only one of sizes – a or b that is connected to inevitable increase of another. It is possible only at increase of volume of sample a simultaneous reduction of probabilities a and b.
What principles should to be guided by at construction of critical area W?
The requirements to critical area can be written down:

i.e. the critical area W should be chosen so that the probability of hit of statistics of criterion in this area would be minimal and equal to a if the hypothesis H 0 is true, and would be maximal if otherwise. Other words, the critical area must be such that at a given significance level a criterion power 1 – b would be maximal. The problem of construction of such a critical area W (or, say, construction of the most powerful criterion) for simple hypotheses is solved by the following theorem:
Theorem (lemma) of Neyman-Pearson. Among all criteria of a given significance level a, testing the simple hypothesis H0, the criterion of relation of plausibility is the most powerful.
Let's explain sense of the theorem, assuming a random variable of X is continuous.
If a simple hypothesis Н 0 is true, density of probability j(x) is uniquely determined and a function of plausibility L0(x) expressing density of probability of joint occurrence of results of sample (x1, x2, …, xn) has the following form:

Let's remind that the function  is a measure of plausibility of reception of sampling observations x1, x2, …, xn.
Similarly, if an alternative hypothesis H 1 is true, function of plausibility has the following form:

The relation of plausibility L1/L0 (for L0 ¹ 0) is considered at Neyman-Pearson theorem: the more plausible a sample in conditions of the hypothesis H 1, the greater the relation L1/L0 or its logarithm ln (L1/L0). And criterion of this relation by the conclusion of theorem is the most powerful among other possible criteria.
Using this criterion, one can find such a constant C (or ln C = c) that

By means of the obtained constant C (or c) a critical area W of criterion and its power are determined.
The principle of testing of a statistical hypothesis does not give the logic proof of its fidelity or incorrectness. Acceptance of the hypothesis H0 in comparison with the alternative hypothesis H1 does not mean that we are sure in absolute correctnessof H0 or that the statement stated in the hypothesis H0 is the best and unique suitable; simply the hypothesis H0 does not contradict the sampling data available at us, and other hypotheses can possess the same property alongside with H0. Thus, an acceptance of the hypothesis H0 should be regarded not just and for ever established absolutely true fact, and only as plausible enough statement not contradicting to experience.
Under the applied maintenance statistical hypotheses can be subdivided into some basic types:
· on equality of numerical characteristics of parent populations;
· on numerical values of parameters;
· on the law of distribution;
· on homogeneity of samples (i.e. belonging of their same parent population);
· on stochastic independence of sample units.
Glossary
substantiated conclusion – обоснованный вывод
benefit of brought fertilizer – польза вносимого удобрения
profitableness of securities – доходность ценных бумаг
to enclose – заключать, окружать; null hypothesis – нулевая гипотеза
competing – конкурирующий; court – суд
verdict of guilty – обвинительный приговор
verdict of «not guilty» – оправдательный приговор
accused – обвиняемый; innocent – невиновный
fulfillment of a crime – совершение преступления
plausibility – правдоподобие
Exercises for Seminar 15
15.1. Check the hypothesis on equality of average productivities in two economies if as a result of a random sample the following results have been received:
The first economy The second economy
| Productivity, centner for 1 hectare | Number of participants | Productivity, centner for 1 hectare | Number of participants | |
| xi | ni | yi | mi | |
| 25-35 | 15-25 | |||
| 35-45 | 25-35 | |||
| 45-55 | 35-45 | |||
| n = 100 | 45-55 | |||
| m = 150 |
(random sample – случайная выборка; productivity – урожайность).
15.2. Check the hypothesis on equality of means at a significance level a = 0,01 on two independent samples of volume n1 and n2 taken from normal parent populations if 
(mean – среднее; significance level – уровень значимости; parent population – генеральная совокупность).
15.3. Test of eight grades of a winter wheat was carried out. Each grade was sowed on 6 allotments of the same area. Check the hypothesis on importance of distinctions in average productivity of two grades of a winter wheat at the significance value 5 % (numbers of grades are given to the student by the teacher).
Productivity of a winter wheat, c/ha:
| Recurrences | Grade | |||||||
| I | ||||||||
| II | ||||||||
| III | ||||||||
| IV | ||||||||
| V | ||||||||
| VI |
(grade – сорт; winter wheat – озимая пшеница; to sow – сеять; allotment – делянка).
15.4. Check the hypothesis on equality of the average score on probability theory and mathematics at the significance value 0,05:
| Probability theory | ||||||||||||||||
| Mathematics |
Exercises for Homework 15
15.5. Check the hypothesis on equality of means at a significance level a = 0,01 on two independent samples of volume n1 and n2 taken from normal parent populations if 
(mean – среднее; significance level – уровень значимости; parent population – генеральная совокупность).
15.6. A sampling inspection of 10 % of personal plots of eight districts was made by random repetition-free way. The following results on productivity of vegetables are received:
| № п/п | Productivity, c/ha | Average quadratic deviation, c/ha | Part of vegetables in the area of plots, % | Number of the surveyed plots |
Check the hypotheses at the significance value 0,05 on two areas on equality of: dispersions, average sampling productivities, parts of crops of vegetables in the area of personal plots (personal plot – приусадебный участок; repetition-free – бесповторный; to survey – обследовать).
15.7. Results of performances of sportsmen were estimated by two judges on a ten-mark scale:
| Number of a sportsman | |||||||||||
| Estimation of the judge | 8,5 | 9,0 | 7,4 | 9,4 | 9,7 | 6,5 | 7,1 | 8,3 | 9,1 | 8,0 | |
| 8,3 | 9,1 | 7,7 | 9,3 | 9,2 | 6,0 | 7,3 | 8,1 | 9,1 | 7,9 |
Check the hypothesis on importance of distinctions in an estimation of performances of sportsmen two judges at the significance value 0,05 (performance – выступление; judge – судья).
INDIVIDUAL HOMEWORKS
Variant 1
1. A die is tossed. What is the probability that the die lands on 2? What is the probability that the die lands on a number greater than 3?
2. A student after lectures at a university can come back home either by a trolleybus or by a tram. He goes differently: he chooses a trolleybus for 2/5 cases and a tram for 3/5 cases. If he goes by a trolleybus, he comes back home to four o'clock in the afternoon in 70 % of cases, and if he goes by a tram, he comes back – only in 65 % of cases. What is the probability that he will come back home by four o'clock for a randomly taken day?
3. A standard production makes on the average 97% at some factory. A randomly selected batch of products consisting of 200 units is checked. If 7 or more non-standard products will be among them, the batch is rejected. Find the probability that: a) there will be 4 non-standard products in the batch; b) the batch of products will be accepted.
4. Discrete independent random variables X and Y are given by the following laws of distribution:
| X | Y | –2 | – 1 | ||||
| P | 0,3 | 0,7 | P | 0,2 | 0,4 | 0,4 |
Find M (X + Y) by two ways: 1) composing the law of distribution of X + Y; 2) using the property: M (X + Y) = M (X) + M (Y).
5. The density of distribution of a continuous random variable X is given:

Find: a) the distribution function F(x); b) the probability of hit of the random variable X into the interval (2,5; 7).
6. A chemist is making a weighing a certain chemical substance without regular mistakes. Random errors of weighing are subordinated to a normal law with dispersion equal 225. Find the probability that a weighing will be made with a mistake which is not exceeding 5 by absolute value (weighing – взвешивание; substance – вещество).
7. The probability of occurrence of a certain event is equal to 0,6 in each of independent trials. 1000 trials have been made. Find the probability that the relative frequency of occurrence of the event deviates from its probability less than on 0,05.
8. The following data on contents of copper in ore (in grammes per one kg of ore) have been obtained after inspecting 80 samples (ore – руда):
1) Compose the interval and the discrete variation series taking the beginning of the first interval equal 100, and the width of each interval equal 50.
2) Construct the histogram and the polygon of relative frequencies of distribution.
3) Find the mode and the median (using the discrete series).
4) Find empirical functions of distribution of continuous and discrete variation series; and construct their graphs.
Variant 2
1. Two shooters make shots in a target. The probability of hit in the target at one shot by the first shooter is 0,7; and by the second shooter – 0,9. Find the probability that at one shot: a) both shooters will hit in the target; b) only one of the shooters will hit in the target.
2. Two automatic devices make plastic hangers. The probability of making a non-standard hanger by the first automatic device is 0,08; and by the second – 0,1. The productivity of the first automatic device is twice more than the second. Find the probability that a randomly taken detail will be non-standard.
3. The probability that a receipt written out by a shop assistant will be paid by a buyer is equal to 0,8. The shop assistant has written out 16 receipts. Find the most probable number of paid receipts and calculate its probability (receipt – чек).
4. Two independent random variables X and Y are given by the following tables of distribution:
| X | Y | ||||||
| P | 0,7 | 0,3 | P | 0,5 | 0,3 | 0,2 |
Compose the law of distribution of their sum Z = X + Y and check the property: D(X + Y) = D(X) + D(Y).
5. The random variable X is given by the distribution function:

Find: a) the mathematical expectation and the dispersion; b) the probability of hit of the random variable X into the interval (3; 8).
6. It is supposed that the strength of a let out party of a parachute fabric is a normally distributed random variable X with the mathematical expectation a = 200 kg/cm2 and the mean square deviation s = 12 kg/cm2 (to let out – выпускать; parachute fabric – парашютная ткань).
Find: 1) the differential function of distribution f(x) and the integral function of distribution F(x); 2) the probability that X will take on a value from 175 up to 225 kg/cm2.
7. A factory makes products, and 80% of them are the first grade. Estimate the probability that the part of products of the first grade among 10000 made products will differ from the probability of making a product of the first grade no more than on 0,03 by absolute value.
8. There are the following data on lifetime of a separate parachute produced by a certain factory after studying 50 samples:
1) Compose the interval and the discrete variation series taking the beginning of the first interval equal 100, and the width of each interval equal 50.
2) Construct the histogram and the polygon of relative frequencies of distribution.
3) Find the mode and the median (using the discrete series).
4) Find empirical functions of distribution of continuous and discrete variation series; and construct their graphs.
Variant 3
1. A die is tossed once. Find the probabilities of the following events:
a) appearance of an odd number of aces;
b) appearance of no less than 4 aces;
c) appearance of no more than 2 aces.
2. Products of a certain kind are delivered in a shop from three factories. The first factory delivers 45% of all products, the second – 40%, and the third – 15%. The probability that a product of the first factory is non-defective is equal to 0,6, of the second – 0,7, and of the third – 0,85. One product has been bought. It appeared non-defective. Determine the probability that the bought product has been made by the third factory.
3. A coming up seeds of a given grade of cucumber is 0,8. Find the probability that the number of grown seeds will be between 775 and 810 from 1000 planted seeds.
4. Two independent random variables X and Y are given by the following tables of distribution:
| X | Y | ||||||
| P | 0,4 | 0,3 | 0,3 | P | 0,7 | 0,3 |
Compose the table of distribution of the random variable X – Y and check the property: D(X – Y) = D(X) + D(Y).
5. A random variable X is given by the density of distribution  in the interval (0; 4), and f(x) = 0 outside of the interval. Find: a) the dispersion of the random variable X; b) the probability of hit of the random variable X into the interval (2; 5).
6. A fat content of milk of cows in collective farms of a region (in percentage) is a normally distributed random variable with mathematical expectation 4 and mean square deviation 1. Find the probability that the random variable differs from its mathematical expectation no more than 0,3 (collective farm – колхоз).
7. The dispersion of each of pairwise independent random variables does not exceed 15. Estimate the probability that the deviation of the arithmetic mean of 2000 these variables from the arithmetic mean of their mathematical expectations will not exceed 0,5.
8. There are the following data on the size of annual revenues of 60 joint-stock companies:
1) Compose the interval and the discrete variation series taking the beginning of the first interval equal 500, and the width of each interval equal 50.
2) Construct the histogram and the polygon of relative frequencies of distribution.
3) Find the mode and the median (using the discrete series).
4) Find empirical functions of distribution of continuous and discrete variation series; and construct their graphs.
Variant 4
1. Assume that the probability to destroy a tank by one grenade is 0,6. What is the probability that 3 grenades will destroy a tank if it is enough one hit in the target for destroying a tank? (to destroy – уничтожить; grenade – граната).
2. A buyer can direct to one of three cash desks to pay for milk. The probabilities of directing to each cash desk depend on their location and are equal 0,3; 0,6; 0,1 respectively. The probability that milk available in a cash desk will be sold out to the moment of arrival of the buyer equal for cash desks 0,7; 0,6; 0,5 respectively. The buyer has directed to one of cash desks and bought milk. Find the probability that he or she has bought milk in the second cash desk (cash desk – касса).
3. The probability of striking a target by a shooter from a rifle at one shot is 0,8. Find the probability that the shooter will hit in the target at 200 shots no less than 150 and no more than 175 times.
4. Two independent random variables X and Y are given by the following tables of distributions:
| X | Y | ||||||
| P | 0,2 | 0,4 | 0,4 | P | 0,7 | 0,3 |
Compose the table of distribution of the random variable Z = X + Y and check the property: M (X + Y) = M (X) + M (Y).
5. The probability density of distribution of a random variable X is

Find: a) the parameter C; b) the distribution function F(x); c) the probability that the random variable X will take on a value from the interval (3; 9).
6. The size of diameter of a steel wire letting out by an automatic device is distributed under a normal law with mathematical expectation a = 4 mm and dispersion 0,64. Find the probability that the diameter of a randomly taken steel wire: a) will be from 3,6 up to 4,3 mm; b) differs from the mathematical expectation no more than on 0,1 mm.
7. The discrete random variable X is given by the following law of distribution:
| X | |||
| Р | 0,3 | 0,1 | 0,6 |
By using the Chebyshev’s inequality estimate the probability that the random variable X differs from its mathematical expectation no more than on 2,5 by absolute value.
8. There are the following data on the size of monthly salaries of 70 workers of service sphere:
1) Compose the interval and the discrete variation series taking the beginning of the first interval equal 150, and the width of each interval equal 50.
2) Construct the histogram and the polygon of relative frequencies of distribution.
3) Find the mode and the median (using the discrete series).
4) Find empirical functions of distribution of continuous and discrete variation series; and construct their graphs.
Variant 5
1. A student knows 25 of 30 questions of a program. Determine the probability that he or she will answer both of two randomly chosen questions at an exam.
2. There are 50% of the first-year students (60% of them are girls), 35 % of the second-year (50% – girls), and 15 % of the third-year (40% – girls) in a hostel. All girls are on duty at the entrance in the hostel by turns. Find the probability that a girl of the second year is on duty at the entrance for a randomly chosen day (hostel – общежитие; to be on duty – дежурить; by turns – по очереди).
3. A batch of products of some factory has been delivered in a warehouse. It is known that the factory lets out on the average 90% of production of the first grade. 4 products are randomly selected. What is the probability that no less than two products of the first grade will be among them?
4. Two independent random variables X and Y are given by the following tables of distribution:
| X | Y | ||||||
| P | 0,4 | 0,2 | 0,4 | P | 0,7 | 0,3 |
Compose the table of distribution of the random variable Z = X + Y and check the property: M (X + Y) = M (X) + M (Y).
5. A random variable X is given by the density of distribution  in the interval (0; 3/2), and f(x) = 0 outside of the interval. Find:
a) the mathematical expectation and the dispersion of the random variable X;
b) the probability of hit of the random variable X into the interval (1; 4).
6. Let the weight of a stick of smoked sausage of a given batch is a random variable X distributed under a normal law of distribution with mathematical expectation 400 g and mean square deviation 10 g. Determine the probability that the weight of a randomly taken stick from the batch: a) is in limits from 390 g up to 420 g; b) differs from the mathematical expectation no more than on 2,8 g by absolute value (stick of smoked sausage – палка копченой колбасы).
7. Let  By using the Chebyshev’s inequality find С.
8. There are the following data on cost in tenghe of 100 available goods in a shop:
1) Compose the interval and the discrete variation series taking the beginning of the first interval equal 100, and the width of each interval equal 10.
2) Construct the histogram and the polygon of relative frequencies of distribution.
3) Find the mode and the median (using the discrete series).
4) Find empirical functions of distribution of continuous and discrete variation series; and construct their graphs.
Variant 6
1. There are 100 tickets in a lottery, and 10 of them are winning. A participant of the lottery buys two tickets. Determine the probability that at least one of them will be winning.
2. At a factory making toys the first machine produces 60 %, the second – 30 %, and the third – 10 % of all toys. The probability that a randomly chosen toy produced by the first machine is defective equals 0,07, by the second – 0,03, and by the third – 0,01. What is the probability that a randomly chosen toy will be defective?
3. The probability that a coin lands on heads at one tossing is equal to 0,5. Calculate the probability that the coin lands on heads exactly two times at four tossings.
4. Two independent random variables X and Y are given by the following tables of distribution:
| X | Y | ||||||
| P | 0,6 | 0,4 | P | 0,2 | 0,6 | 0,2 |
Compose the table of distribution of the random variable Z = X + Y and check the property: M (X + Y) = M(X) + M (Y).
5. A random variable X is given by the integral function:

Find a) the differential function f(x); b) the mathematical expectation and the dispersion of X; c) the probability of hit of X into the interval (3/5; 6/5).
6. It is supposed that the durability limit of a let out party of a parachute fabric is a normally distributed random variable X with the dispersion equal 100 kg/cm2. What maximal deviation of the durability limit of a tested sample of a parachute fabric from the mathematical expectationcan be guaranteed with probability 0,925 by absolute value?
7. The probability of appearance of an event is 1/6 in each trial. By using the Chebyshev’s inequality estimate the probability that the number of appearances of the event differs from the mathematical expectation less than on 30 if 900 trials will be made.
8. There are the following data on the size of monthly salaries of bookkeepers of 100 commercial firms:
1) Compose the interval and the discrete variation series taking the beginning of the first interval equal 330, and the width of each interval equal 10.
2) Construct the histogram and the polygon of relative frequencies of distribution.
3) Find the mode and the median (using the discrete series).
4) Find empirical functions of distribution of continuous and discrete variation series; and construct their graphs.
Variant 7
1. A buyer has bought a TV set and a video recorder. The probability that a TV set will sustain its warranty period is 0,9 and a video recorder – 0,85. Find the probability that: a) both devices will sustain their warranty periods; b) at least one of them will sustain the own warranty period (to sustain a warranty period – выдержать гарантийный срок).
2. Assume that 40% of all men and 30% of all women are short-sighted persons. A randomly chosen person is short-sighted. Assume that the numbers of men and women are equal. What is the probability that this person is a woman? (short-sighted – близорукий).
3. A coming up seeds of a given grade of rice is estimated with the probability equal 0,9. What is the probability that no less than five seeds will come up from the sown six ones? (to come up – всходить; seed – семя; grade – сорт; rice – рис; to sow – сеять).
4. Two independent random variables X and Y are given by the following tables of distribution:
| X | Y | ||||||
| P | 0,3 | 0,5 | 0,2 | P | 0,6 | 0,4 |
Compose the table of distribution of the random variable Z = X × Y and check the property: M(X × Y) = M(X) × M(Y).
5. The probability density of distribution of a random variable is given by:

Find the parameter C, the mathematical expectation, the dispersion, the distribution function of the random variable X, and the probability of the event: –2 < X < 2.
6. A normally distributed random variable X is given by the following density of distribution: 
Find the probability of hit of the random variable X into the interval (2; 4).
7. The average value of the weight of a product is 300 grammes, and the dispersion is 20. By using the Chebyshev’s inequality estimate the probability that the weight of a randomly taken product will be no less than 280 g and no more than 320 g.
8. There are the following data on the size of revenues of 100 small banks:
1) Compose the interval and the discrete variation series taking the beginning of the first interval equal 200, and the width of each interval equal 10.
2) Construct the histogram and the polygon of relative frequencies of distribution.
3) Find the mode and the median (using the discrete series).
4) Find empirical functions of distribution of continuous and discrete variation series; and construct their graphs.
Variant 8
1. There are 13 green and 19 red balls in an urn. One ball has been randomly taken out from the urn and put aside. This ball was green. After that one more ball is randomly taken out from the urn. Find the probability that this ball will be also green.
2. Two persons have typed an identical quantity of pages of a text. The probability that the first person will make a mistake is 0,08, and the second – 0,12. One mistake has been found out at verification of the text. Find the probability that the first person has mistaken.
3. The probability of hit in a target at each shot by a rifle is 0,7. How many shots should make in order that the most probable number of hits was equal to 30?
4. Two independent random variables X and Y are given by the following tables of distributions:
| X | Y | ||||||
| P | 0,5 | 0,2 | 0,3 | P | 0,4 | 0,6 |
Compose the table of distribution of the random variable Z = X + Y and check the property: M (X + Y) = M(X) + M (Y).
5. The density of distribution of a continuous random variable X is given by:

Find: a) the distribution function F(x); b) the probability of hit of the random variable X into the interval (2; 4).
6. A normally distributed random variable X is given by the following density of distribution:

Find the probability of hit of the random variable X into the interval (– 2; 4).
7. The probability of occurrence of a certain event is 0,6 in each trial. By using the Chebyshev’s inequality estimate the probability that the number of occurrences of the event will be in limits from 100 up to 140 if 200 independent trials will be made.
8. There are the following data on weight of a detail produced by an automatic device after studying 100 samples:
1) Compose the interval and the discrete variation series taking the beginning of the first interval equal 280, and the width of each interval equal 10.
2) Construct the histogram and the polygon of relative frequencies of distribution.
3) Find the mode and the median (using the discrete series).
4) Find empirical functions of distribution of continuous and discrete variation series; and construct their graphs.
Variant 9
1. A student came to pass an exam knowing only 38 questions of 50. What is the probability that he or she pass the exam if the student can’t answer a randomly chosen question, the teacher asks one more question?
2. Two shooters make shots in a target simultaneously. It is known that the probability of hit by the first shooter is 0,7, and by the second – 0,8. The target has been struck once. What is the probability that the target will not be struck by the first shooter?
3. A plane has made 25 shots in an object. The probability of hit at one shot is 0,5. Find the most probable number of hits and the probability of this number of hits.
4. Two independent random variables X and Y are given by the following laws of distribution:
| X | Y | ||||||
| P | 0,7 | 0,3 | P | 0,1 | 0,5 | 0,4 |
Compose the law of distribution of the random variable Z = X × Y and check the property: M(X × Y) = M (X) × M (Y).
5. A random variable X is given by the integral function:

Find: а) the differential function f(x); b) the mathematical expectation and the dispersion of X; c) the probability of hit of the random variable X into the interval (5/6; 6/5).
6. A normally distributed random variable X is given by the following density of distribution:

Find the probability of hit of the random variable X into the interval (– 3; 5).
7. There are 1500 green and 2500 red balls in an urn. 400 balls have been taken out from the urn (with returning). Estimate the probability that the number m of extracted green balls satisfies the double inequality: 120 < m < 180.
8. At inspecting 100 products of a given batch the following data on weight of a separate product (in grammes) have been obtained:
1) Compose the interval and the discrete variation series taking the beginning of the first interval equal 800, and the width of each interval equal 10.
2) Construct the histogram and the polygon of relative frequencies of distribution.
3) Find the mode and the median (using the discrete series).
4) Find empirical functions of distribution of continuous and discrete variation series; and construct their graphs.
Variant 10
1. Three dice are tossed. Find the probability that the sum of landed aces of the dice is divided on 5.
2. A collector has received 4 boxes of details made by the first factory, and 3 boxes of details made by the second factory. The probability that a detail of the first factory is standard is equal to 0,75; the second factory – 0,85. Find the probability that a randomly extracted detail from a randomly chosen box will be standard (collector – сборщик).
3. There is a group of 60 persons born at April. Find the probability that the birthday for three persons will be the first of April. Assume that the probability of a birth in a fixed day of April is equal to 1/30.
4. The probability that a book necessary for a student is available in a library is equal to 0,4. Compose the law of distribution of the number of libraries which will be visited by the student if there are five libraries in the city.
5. The distribution function of a continuous random variable X is given by:

Find: 1) the density of distribution; 2) the mathematical expectation and the dispersion of X; 3) the probability of hit of the random variable X into the interval (0; p/8).
6. A random variable X is normally distributed with mathematical expectation M(X) = 12 and dispersion D(X) = 4. Find the probability that:
а) X will take on a value belonging to the interval (7; 14);
b) X will differ from the mathematical expectation less than on 1,5.
7. The dispersion of each of 1000 independent random variables does not exceed 4. Estimate the probability that the arithmetic mean of these random variables will differ from the arithmetic mean of their mathematical expectations less than on 0,15.
8. There are the following data on monthly volume of cigarettes (in thousand packs) of 100 supermarkets:
&n
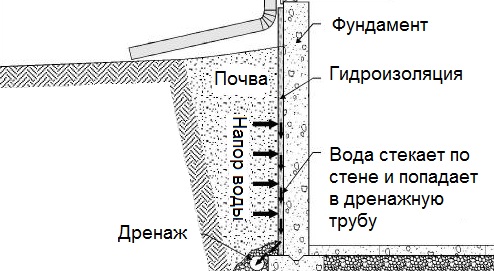 Общие условия выбора системы дренажа: Система дренажа выбирается в зависимости от характера защищаемого...  Механическое удерживание земляных масс: Механическое удерживание земляных масс на склоне обеспечивают контрфорсными сооружениями различных конструкций... 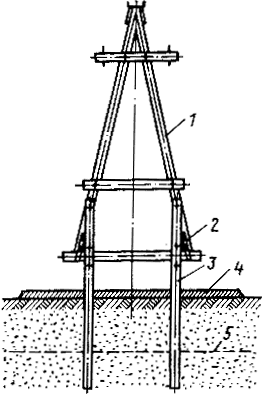 Особенности сооружения опор в сложных условиях: Сооружение ВЛ в районах с суровыми климатическими и тяжелыми геологическими условиями... 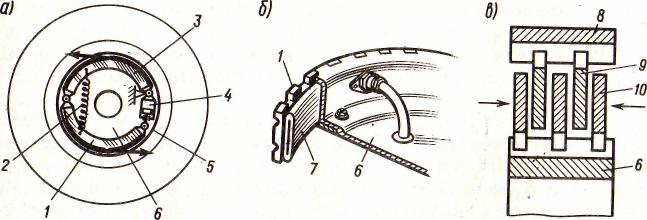 Автоматическое растормаживание колес: Тормозные устройства колес предназначены для уменьшения длины пробега и улучшения маневрирования ВС при... © cyberpedia.su 2017-2026 - Не является автором материалов. Исключительное право сохранено за автором текста. |

