
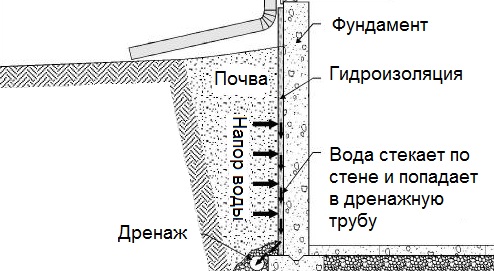
Общие условия выбора системы дренажа: Система дренажа выбирается в зависимости от характера защищаемого...
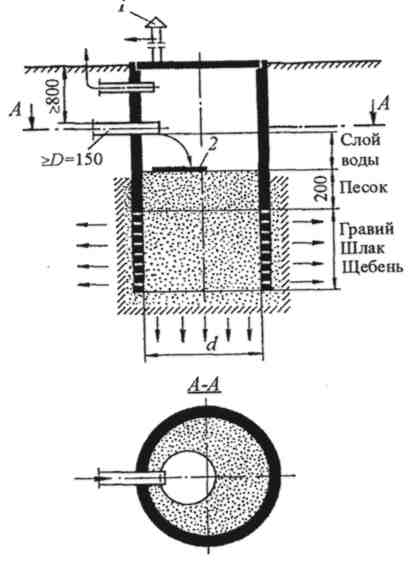
Индивидуальные очистные сооружения: К классу индивидуальных очистных сооружений относят сооружения, пропускная способность которых...
Общие условия выбора системы дренажа: Система дренажа выбирается в зависимости от характера защищаемого...
Индивидуальные очистные сооружения: К классу индивидуальных очистных сооружений относят сооружения, пропускная способность которых...
Топ:
Марксистская теория происхождения государства: По мнению Маркса и Энгельса, в основе развития общества, происходящих в нем изменений лежит...
Устройство и оснащение процедурного кабинета: Решающая роль в обеспечении правильного лечения пациентов отводится процедурной медсестре...
Характеристика АТП и сварочно-жестяницкого участка: Транспорт в настоящее время является одной из важнейших отраслей народного хозяйства...
Интересное:
Влияние предпринимательской среды на эффективное функционирование предприятия: Предпринимательская среда – это совокупность внешних и внутренних факторов, оказывающих влияние на функционирование фирмы...
Подходы к решению темы фильма: Существует три основных типа исторического фильма, имеющих между собой много общего...
Отражение на счетах бухгалтерского учета процесса приобретения: Процесс заготовления представляет систему экономических событий, включающих приобретение организацией у поставщиков сырья...
Дисциплины:
|
из
5.00
|
Заказать работу |
Содержание книги
Поиск на нашем сайте
|
|
|
|
Mathematical statistics is the section of mathematics studying mathematical methods of gathering, ordering, processing and interpretation of results of supervision with the purpose of revealing statistical regularities.
Establishment of statistical regularities inherent in mass random phenomena is based on studying of the statistical data – data on what values have been accepted as a result of observation by an attribute interesting us (random variable X).
In real social and economic systems it is impossible to carry out active experiments; therefore the data usually represent observations over occurring process, for example: an exchange rate at a stock exchange within a month, productivity of wheat in a farm for 30 years, labor productivity of workers for a change, etc. Results of observations are, generally, a series of numbers located in the disorder which for studying it is necessary to order (rank).
The operation of ordering the values of an attribute on increase (decrease) is said to be ranking of experimental data.
After operation of ranking the experimental data can be grouped so that in each group the attribute accepted the same value which refers to as a variant (xi), i.e. various values of an attribute are variants. The number of elements in each group refers to as frequency (ni) of a variant. The sum of all frequencies is equal to the certain number n which refers to as volume of set:

The ratio of frequency of the given variant to volume of set is relative frequency (wi) of this variant: wi = ni/n. Frequencies and relative frequencies are said to be weights.
A variation series is a ranked series of variants with corresponding weights (frequencies and relative frequencies) in increasing (or decreasing) order.
At studying variation series alongside with the notion of frequency the notion of cumulative frequency ( ) is used. Cumulative frequency shows how many variants with value of an attribute smaller x were observed. The ratio of cumulative frequency to the volume of set n is said to be cumulative relative frequency (
 ).
).
For the task of a variation series it is enough to specify variants and frequencies (relative frequencies) corresponding to them or cumulative frequencies (cumulative relative frequencies).
Variation series are discrete and continuous (interval). A discrete variation series is a ranked sequence of variants with corresponding frequencies and (or) relative frequencies.
Example 1. As a result of testing a group of 24 persons has obtained the following points: 4, 0, 3, 4, 1, 0, 3, 1, 0, 4, 0, 0, 3, 1, 0, 1, 1, 3, 2, 3, 1, 2, 1, 2. Construct the discrete variation series.
Solution: Rank the original series, account frequency and relative frequency of variants:
0, 0, 0, 0, 0, 0, 1, 1, 1, 1, 1, 1, 1, 2, 2, 2, 3, 3, 3, 3, 3, 4, 4, 4.
As a result we obtain a discrete variation series:
| Point, xi | Frequency (the number of students) ni | Relative frequency, wi |
| 6/24 | ||
| 7/24 | ||
| 3/24 | ||
| 5/24 | ||
| 3/24 | ||
| S |
If the number of values of an attribute is great, the construction of a discrete variation series is inexpedient. In this case it is necessary to construct an interval variation series. For construction of such a series the interval of variation of an attribute is subdivided into a series of separate intervals, and the amount of values of the quantity in each of them is counted.
The recommended number of intervals is calculated by the following formula: m = 1 + 3,322 lg n, and size of an interval (an interval difference, width of an interval) –  where xmax – xmin is the difference between the greatest and the least values of an attribute.
Example 2. Let a series of distribution of farms by amount of workers on 100 hectares of agricultural fields is given (n = 60):
Find the recommended number of intervals: m = 1 + 3,322 lg 60» 6,907; m = 7.
Find size of partial interval: k = (15 – 4)/7» 1,6.
Construct an interval variation series using xmin as an initial value. Divide the interval of variation of the attribute X into m = 7 partial intervals with step k = 1,6 and count the number of workers on 100 hectares of agricultural fields in each interval:
| Groups of farms on amount of workers on 100 hectares | Frequency (the number of farms in the group) ni | Cumulative frequency (cumulative number of farms) 
| Relative frequency, wi |
| 4 – 5,6 | 5/60 | ||
| 5,61 – 7,2 | 17/60 | ||
| 7,21 – 8,8 | 9/60 | ||
| 8,81 – 10,4 | 15/60 | ||
| 10,41 – 12,0 | 10/60 | ||
| 12,01 – 13,6 | 1/60 | ||
| 13,61 – 15,2 | 3/60 | ||
| S | - |
Variation series are presented graphically by means of polygon and histogram. Polygon of frequencies is a broken line segments of which connect points (x1; n1), (x2; n2), …, (xk; nk). Polygon of relative frequencies is a broken line segments of which connect points (x1; n1/n), (x2; n2/n), …, (xk; nk/n).
Construct a polygon of frequencies for Example 1:

The figure consisting of rectangles with the basis k and heights ni refers to as a histogram of frequencies. For a histogram of relative frequencies as a height is considered ni/n.
Construct a histogram of frequencies for Example 2.

|
|
|
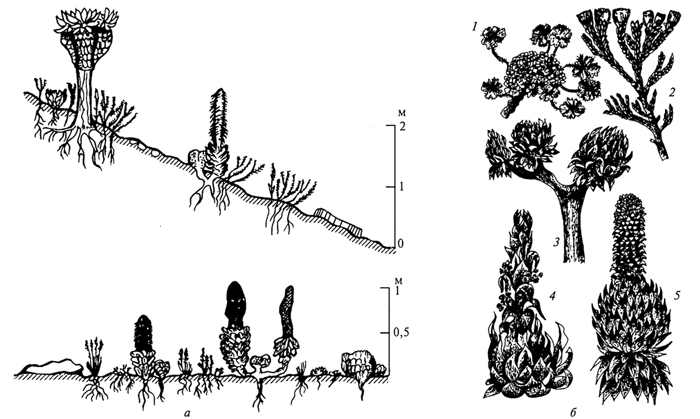
Адаптации растений и животных к жизни в горах: Большое значение для жизни организмов в горах имеют степень расчленения, крутизна и экспозиционные различия склонов...
Индивидуальные очистные сооружения: К классу индивидуальных очистных сооружений относят сооружения, пропускная способность которых...
Общие условия выбора системы дренажа: Система дренажа выбирается в зависимости от характера защищаемого...
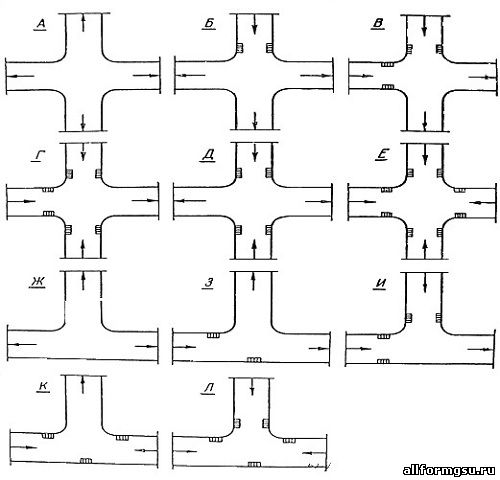
Организация стока поверхностных вод: Наибольшее количество влаги на земном шаре испаряется с поверхности морей и океанов (88‰)...
© cyberpedia.su 2017-2026 - Не является автором материалов. Исключительное право сохранено за автором текста.
Если вы не хотите, чтобы данный материал был у нас на сайте, перейдите по ссылке: Нарушение авторских прав. Мы поможем в написании вашей работы!

