• Ways that countries interact economically
– Trade (per CIA, 2013 est.)
• World exports: $18.71 trillion
(compare world GDP of $87 trillion)
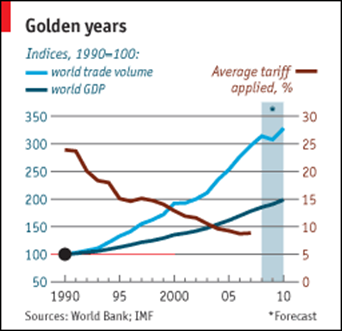
• World trade has grown faster than world GDP most years
– But not during 2008-9, due to world recession
• See tables below for
– Who trades most?
– Who trades with whom?
– Share of trade in GDP
– US:
• What do we export/import?
• To/from whom?
Who Trades the Most? ($ b. & % share, 2013)
| Exporters
| Importers
|
| | Value
| Share
| | Value
| Share
|
| EU-28*
|
| 15.3
| US
|
| 15.4
|
| China
|
| 14.7
| EU-28*
|
| 14.8
|
| US
|
| 10.5
| China
|
| 12.9
|
| Japan
|
| 4.8
| Japan
|
| 5.5
|
| Korea, S.
|
| 3.7
| Hng Kng
|
| 4.1
|
| World
|
| 100.0
| World
|
| 100.0
|
Source: WTO, International Trade Statistics, 2014, Table I.8
Who Trades the Most?
• Developed countries are the biggest traders
• China is catching up, in trade volume
– It was the #3 exporter six years ago when I taught the course; now it’s #2 and closing in on EU.
– Others are gaining as well: Four years ago Canada was #5 exporter. Three years ago that was S Korea
• See Economist from about a year ago: “Trading Up: Picking the world champion of trade”
– China claimed to have surpassed US. True only for goods, not goods + services
• But with time China will pass US in both
– China’s trade per GDP is much larger than the US, but below world average
– Much of the value in China’s exports is imported inputs, thus low “value added.”
• “Emerging Markets” in general are catching up to, or surpassing, the developed countries
– In GDP, trade, and more
– See Economics Focus from The Economist, “Why the Tail Wags the Dog”

What Does the World Trade? ($ b. 2013 & annual % growth rates, merchandise exports)
| | Value
| 00-05
| 05-13
|
|
|
|
|
|
| All Products
| 17,590
| | | | | | | |
| Agriculture
| 1,745
|
|
| –12
|
|
|
|
|
| Fuel&Mining
| 3,997
|
|
| –36
|
|
|
| –3
|
| Manuf.
| 11,848
|
|
| –20
|
|
|
|
|
Source: WTO, International Trade Statistics, 2014, Table II.1
What Does the World Trade?
• Biggest traded category: manufactures
• Fastest growing, then shrinking, then growing: “fuels & mining”
Why?
• Because this is the value of trade, and prices of oil and other raw materials were rising, and then falling.
But within Manufactures, Iron & Steel is even more volatile:
What Does the World Trade?($ b. 2013 & annual % growth rates, merchandise exports)
| | Value
| 00-05
| 05-13
|
|
|
|
|
|
| All Products
| 17,590
| | | | | | | |
| Agriculture
| 1,745
|
|
| –12
|
|
|
|
|
| Fuel&Mining
| 3,997
|
|
| –36
|
|
|
| –3
|
| Manuf.
| 11,848
|
|
| –20
|
|
|
|
|
| Iron & Steel
|
|
|
| –45
|
|
| –8
| –6
|
Source: WTO, International Trade Statistics, 2014, Table II.1
Reason: Very sensitive to investment, thus to expansion and contraction.
What Does the World Trade?($ b. 2013 & annual % growth rates, merchandise exports)
| | Value
| 00-05
| 05-13
|
|
|
|
|
|
| All Products
| 17,590
| | | | | | | |
| Agriculture
| 1,745
|
|
| –12
|
|
|
|
|
| Fuel&Mining
| 3,997
|
|
| –36
|
|
|
| –3
|
| Manuf.
| 11,848
|
|
| –20
|
|
|
|
|
| Iron & Steel
|
|
|
| –45
|
|
| –8
| –6
|
| Automotive
| 1,348
|
|
| –31
|
|
|
|
|
Source: WTO, International Trade Statistics, 2014, Table II.1
What Does the US Trade?($ b. 2011)
| | Exports
| Imports
|
| Total
| 1,497.4
| 2,235.8
|
| Agriculture
| 140.0
| |
| Petroleum
| | 462.3
|
| Industrial supplies
| 496.4
| 319.8
|
| Capital goods, exc. auto
| 493.2
| 513.4
|
| Automotive
| 133.1
| 255.2
|
| Other non-ag
| 234.6
| |
| Other non-petrol
| | 685.1
|
Source: Economic Report of the President, Feb 2013, Table B-104.
What Does the US Trade?
US imports are much larger than US exports (We’ll see what that means later in the course.)
US is a big…
-Exporter of agricultural products
-Importer of oil
-Exporter and importer of capital goods (i.e., machines for making things)
Importance of Trade for Countries? (GDP in US$ b., Exports % of GDP, Selected countries, 2012)
| | GDP
| Exports/GDP
|
| United States
|
| 9%
|
| Japan
|
| 14%
|
| Germany
|
| 42%
|
| Canada
|
| 25%
|
| India
|
| 19%
|
| Mexico
|
| 28%
|
| Netherlands
|
| 80%
|
| Singapore
|
| 139%
|
| Philippines
|
| 17%
|
| Nepal
|
| 5%
|
Source: CIA World Fact Book
Importance of Trade for Countries?
• Even though we trade more than most, US trade is a smaller part of US GDP than for many other countries
• Others that are low: Japan, Nepal (even lower than US)
• Note Singapore: Exports can be more than GDP.
– Reason: Exports are made using imported inputs, so value of exports includes imports.