Pie chart Bar chart Table graph


Histogram Cross section flowchart Table
Types of diagrams
Diagrams are visual ways of presenting data concisely. They are often also called figures. In an academic article they are usually labelled Fig. (Figure) 1, Fig.2, etc.
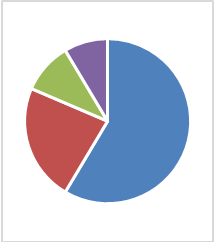
A pie chart is a circle divided into segments from the middle (like slices of a cake) to show how the total is divided up. A key or legend shows what each segment represents.
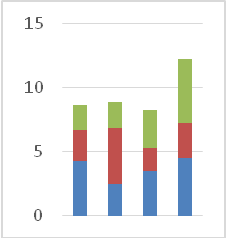
A bar chart is a diagram in which different amounts are represented by thin vertical or horizontal bars chart but the bar width also varies to indicate different values.
A table is a grid with columns and rows of numbers.
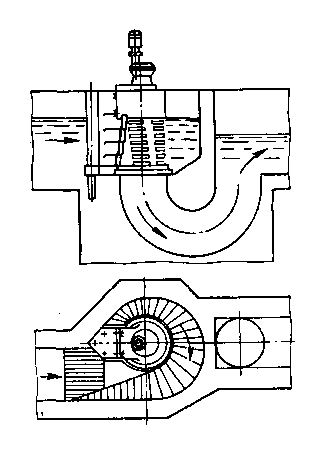
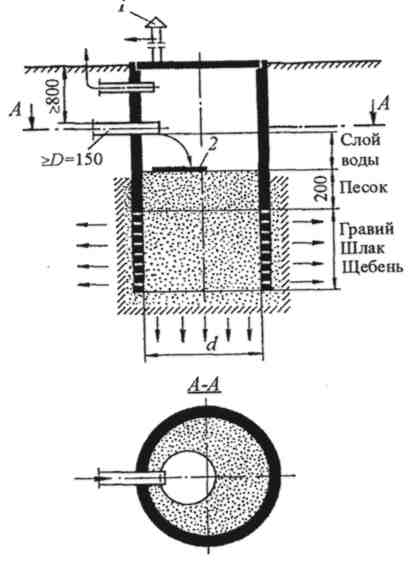
A cross – section is something, or a model of something, cut across the middle so that you can see the inside. A label gives the name of each part of the cross section.
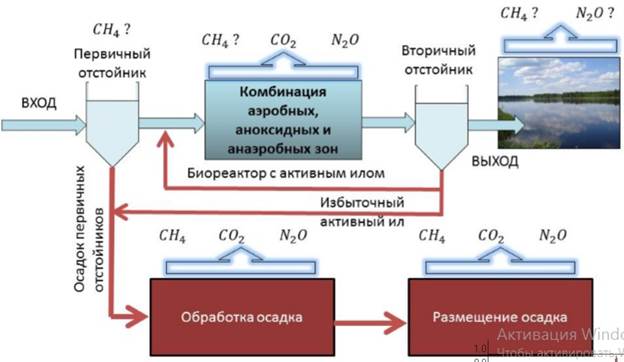
A flow chart is a diagram, which indicates the stages of a process.
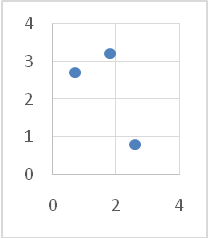
The graph presents data relating to teenagers and pocket money. A random sample of 1000 teenagers were surveyed and the average pocket money received at each age has been plotted on the graph. The x axis or horizontal axis indicates age and the y axis or vertical axis shows the amount of money received per week. The graph shows that 15 year – olds receive twice as much pocket money as 13 –year-olds. From the graph we can see that the amount received reaches a peak at the age of 18 and then starts to decline. This decline can perhaps be explainedby the factthat many teenagers start earning and stop receiving pocket money at the age of 18.
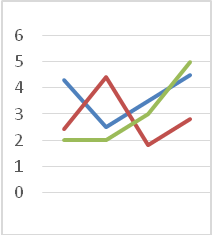
Graphs are drawn by plotting points on them and then drawing a line to join adjacent points. If there are two lines on a graph – separate lines, for example, to indicate boys’ and girls’ pocket money – then the lines would probably cross or intersect at various points. Lines that runparallel to one another never intersect.
Graphs show how numbers increase or decrease. The nouns increase and decrease have the stress on the first syllable, but the verbs have the stress on the second syllable. Numbers can also be said to rise or grow and fall, drop or decline. The nouns rise, growth, fall, drop and decline, like increase and decrease are followed by in (to explain the size of the change), e.g include a rise of 10% in the number of cars. Other verbs used about growth include double, multiply, appreciate and exceed.
Task 6
Answer the questions:
1. Draw examples of a pie chart and bar chart.
2. What would be the best type of diagram to present the different layers of rock in the Grand Canyon?
3. In a table, what is the difference between columns and rows?
4. What would be the best type of diagram to present the different stages in a research project you did?
5. How many segments are there in the pie chart?
6. If you look at two adjacent columns in a table, are they next to each other or separated?
7. What is another name for a legend in a diagram?
8. What type of data collection are you doing if you survey the first 50 people you come across?
9. What do two lines on a graph do if they intersect and they run parallel to each other?
Task 7