
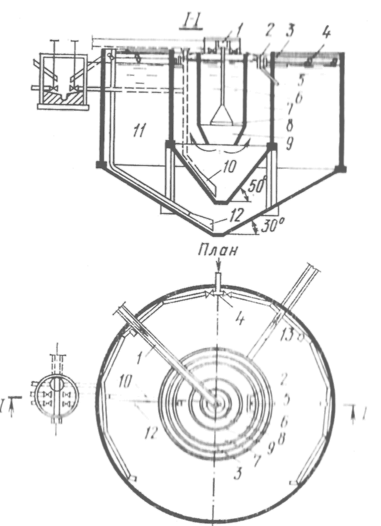
Типы сооружений для обработки осадков: Септиками называются сооружения, в которых одновременно происходят осветление сточной жидкости...

Семя – орган полового размножения и расселения растений: наружи у семян имеется плотный покров – кожура...
Типы сооружений для обработки осадков: Септиками называются сооружения, в которых одновременно происходят осветление сточной жидкости...
Семя – орган полового размножения и расселения растений: наружи у семян имеется плотный покров – кожура...
Топ:
Оснащения врачебно-сестринской бригады.
Генеалогическое древо Султанов Османской империи: Османские правители, вначале, будучи еще бейлербеями Анатолии, женились на дочерях византийских императоров...
Марксистская теория происхождения государства: По мнению Маркса и Энгельса, в основе развития общества, происходящих в нем изменений лежит...
Интересное:
Средства для ингаляционного наркоза: Наркоз наступает в результате вдыхания (ингаляции) средств, которое осуществляют или с помощью маски...
Национальное богатство страны и его составляющие: для оценки элементов национального богатства используются...
Как мы говорим и как мы слушаем: общение можно сравнить с огромным зонтиком, под которым скрыто все...
Дисциплины:
|
из
5.00
|
Заказать работу |
|
|
|
|
Example 3-5 provides source code for the stock monitoring application with three series of data. In addition to the series used in Example 3-4, the previous example, two new series are declared.
The series are assigned to the chart by using consecutive calls of the getData and addAll methods.
| Example 3-5 Adding Two More Series to the Stock Monitoring Sample import javafx.application.Application; import javafx.scene.Scene; import javafx.scene.chart.CategoryAxis; import javafx.scene.chart.LineChart; import javafx.scene.chart.NumberAxis; import javafx.scene.chart.XYChart; import javafx.stage.Stage; public class LineChartSample extends Application { @Override public void start(Stage stage) { stage.setTitle("Line Chart Sample"); final CategoryAxis xAxis = new CategoryAxis(); final NumberAxis yAxis = new NumberAxis(); xAxis.setLabel("Month"); final LineChart<String,Number> lineChart = new LineChart<String,Number>(xAxis,yAxis); lineChart.setTitle("Stock Monitoring, 2010"); XYChart.Series series1 = new XYChart.Series(); series1.setName("Portfolio 1"); series1.getData().add(new XYChart.Data("Jan", 23)); series1.getData().add(new XYChart.Data("Feb", 14)); series1.getData().add(new XYChart.Data("Mar", 15)); series1.getData().add(new XYChart.Data("Apr", 24)); series1.getData().add(new XYChart.Data("May", 34)); series1.getData().add(new XYChart.Data("Jun", 36)); series1.getData().add(new XYChart.Data("Jul", 22)); series1.getData().add(new XYChart.Data("Aug", 45)); series1.getData().add(new XYChart.Data("Sep", 43)); series1.getData().add(new XYChart.Data("Oct", 17)); series1.getData().add(new XYChart.Data("Nov", 29)); series1.getData().add(new XYChart.Data("Dec", 25)); XYChart.Series series2 = new XYChart.Series(); series2.setName("Portfolio 2"); series2.getData().add(new XYChart.Data("Jan", 33)); series2.getData().add(new XYChart.Data("Feb", 34)); series2.getData().add(new XYChart.Data("Mar", 25)); series2.getData().add(new XYChart.Data("Apr", 44)); series2.getData().add(new XYChart.Data("May", 39)); series2.getData().add(new XYChart.Data("Jun", 16)); series2.getData().add(new XYChart.Data("Jul", 55)); series2.getData().add(new XYChart.Data("Aug", 54)); series2.getData().add(new XYChart.Data("Sep", 48)); series2.getData().add(new XYChart.Data("Oct", 27)); series2.getData().add(new XYChart.Data("Nov", 37)); series2.getData().add(new XYChart.Data("Dec", 29)); XYChart.Series series3 = new XYChart.Series(); series3.setName("Portfolio 3"); series3.getData().add(new XYChart.Data("Jan", 44)); series3.getData().add(new XYChart.Data("Feb", 35)); series3.getData().add(new XYChart.Data("Mar", 36)); series3.getData().add(new XYChart.Data("Apr", 33)); series3.getData().add(new XYChart.Data("May", 31)); series3.getData().add(new XYChart.Data("Jun", 26)); series3.getData().add(new XYChart.Data("Jul", 22)); series3.getData().add(new XYChart.Data("Aug", 25)); series3.getData().add(new XYChart.Data("Sep", 43)); series3.getData().add(new XYChart.Data("Oct", 44)); series3.getData().add(new XYChart.Data("Nov", 45)); series3.getData().add(new XYChart.Data("Dec", 44)); Scene scene = new Scene(lineChart,800,600); lineChart.getData().addAll(series1, series2, series3); stage.setScene(scene); stage.show(); } public static void main(String[] args) { launch(args); } } |
Each series of data has its unique name defined by using the setName method.
|
|
The result of compiling and running this application is shown in Figure 3-4.
Figure 3-4 Stock Monitoring Example with Tree Series of Data
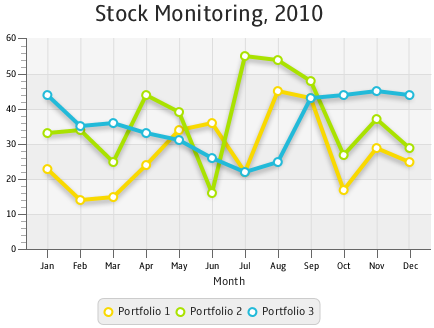
Description of "Figure 3-4 Stock Monitoring Example with Tree Series of Data"
Note that the different colors of the lines are defined by the declared order of the corresponding series in the addAll method. Change the order as follows: lineChart.getData().addAll(series3, series1, series2), and then compile and run the application. The modified output is shown in Figure 3-5.
|
|
|

Своеобразие русской архитектуры: Основной материал – дерево – быстрота постройки, но недолговечность и необходимость деления...

История создания датчика движения: Первый прибор для обнаружения движения был изобретен немецким физиком Генрихом Герцем...
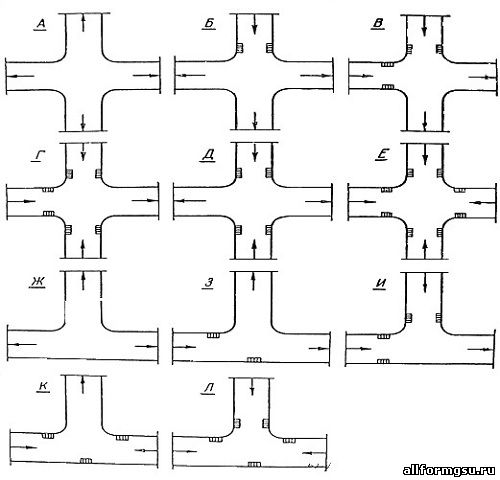
Организация стока поверхностных вод: Наибольшее количество влаги на земном шаре испаряется с поверхности морей и океанов (88‰)...
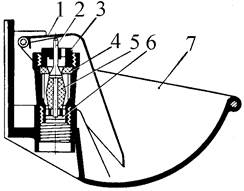
Индивидуальные и групповые автопоилки: для животных. Схемы и конструкции...
© cyberpedia.su 2017-2024 - Не является автором материалов. Исключительное право сохранено за автором текста.
Если вы не хотите, чтобы данный материал был у нас на сайте, перейдите по ссылке: Нарушение авторских прав. Мы поможем в написании вашей работы!