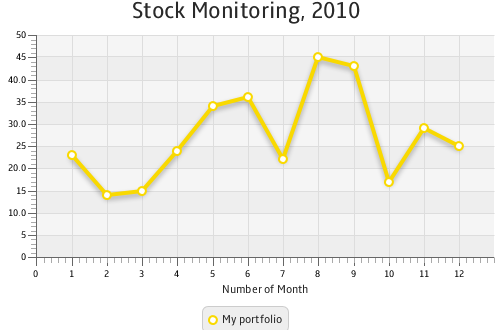
Description of "Figure 3-2 Line Chart with One Series of Data"
The line chart shown in Figure 3-2 uses symbols to highlight each data item on the chart. If you want to show trends instead of specific data values on your line chart, you can disable the chart symbols as shown in Example 3-2.
| Example 3-2 Disabling Symbols for a Line Chart
lineChart.setCreateSymbols(false);
|
The sample of a trend chart is shown in Figure 3-1.
In Figure 3-1, axes are shown in their default positions relative to the chart plot. However, you can display an axis on another side of the chart plot by applying the setSide method. Example 3-3 demonstrates how to move the horizontal axis to the top of the chart plot.
| Example 3-3 Specifying the Axis Side
xAxis.setSide(Side.TOP);
|
Creating Categories for a Line Chart
Use the CategoryAxis class instead of the NumberAxis class to render non-numerical data in a line chart.
Examine the modified code of the application shown in Example 3-4. It creates the horizontal axis by instantiating the CategoryAxis class. The declaration of the LineChart object is modified to accommodate the change of the X axis type.
| Example 3-4 Using Category Axis to Show Months
import javafx.application.Application;
import javafx.scene.Scene;
import javafx.scene.chart.CategoryAxis;
import javafx.scene.chart.LineChart;
import javafx.scene.chart.NumberAxis;
import javafx.scene.chart.XYChart;
import javafx.stage.Stage;
public class LineChartSample extends Application {
@Override public void start(Stage stage) {
stage.setTitle("Line Chart Sample");
final CategoryAxis xAxis = new CategoryAxis();
final NumberAxis yAxis = new NumberAxis();
xAxis.setLabel("Month");
final LineChart<String,Number> lineChart =
new LineChart<String,Number>(xAxis,yAxis);
lineChart.setTitle("Stock Monitoring, 2010");
XYChart.Series series = new XYChart.Series();
series.setName("My portfolio");
series.getData().add(new XYChart.Data("Jan", 23));
series.getData().add(new XYChart.Data("Feb", 14));
series.getData().add(new XYChart.Data("Mar", 15));
series.getData().add(new XYChart.Data("Apr", 24));
series.getData().add(new XYChart.Data("May", 34));
series.getData().add(new XYChart.Data("Jun", 36));
series.getData().add(new XYChart.Data("Jul", 22));
series.getData().add(new XYChart.Data("Aug", 45));
series.getData().add(new XYChart.Data("Sep", 43));
series.getData().add(new XYChart.Data("Oct", 17));
series.getData().add(new XYChart.Data("Nov", 29));
series.getData().add(new XYChart.Data("Dec", 25));
Scene scene = new Scene(lineChart,800,600);
lineChart.getData().add(series);
stage.setScene(scene);
stage.show();
}
public static void main(String[] args) {
launch(args);
}
}
|
The XYChartData objects contain the month name and the corresponding numerical value. The label of the horizontal axis is modified accordingly.
The result of compiling and running the modified code of the application is shown in Figure 3-3.
Figure 3-3 Horizontal Category Axis
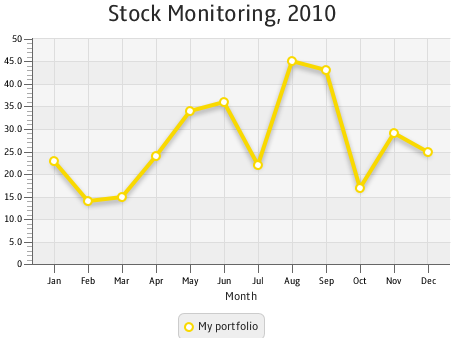
Description of "Figure 3-3 Horizontal Category Axis"
Often, line charts enable analyzing different set of data over the same period of time. Use several series of XYChart.Data objects to implement this task in your application.