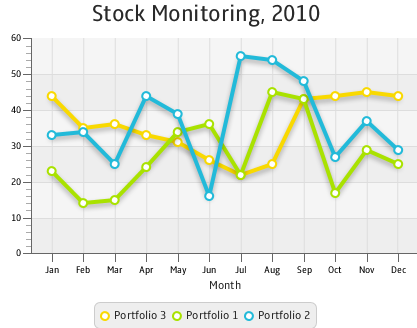
Description of "Figure 3-5 Alternative Order of Series in the Line Chart"
Related API Documentation
- LineChart
- Chart
- XYChart
- XYChart.Data
- XYChart.Series
- Axis
- NumberAxis
- CategoryAxis
Area Chart
This chapter describes the area chart, yet another type of a two-axis chart.
Similar to line charts, it presents data as a series of points connected by straight lines. However, the area between the axis and the line is painted with color. Each series of data is painted with a different color. Figure 4-1 shows an area chart with two series of data.
Figure 4-1 Typical Area Chart
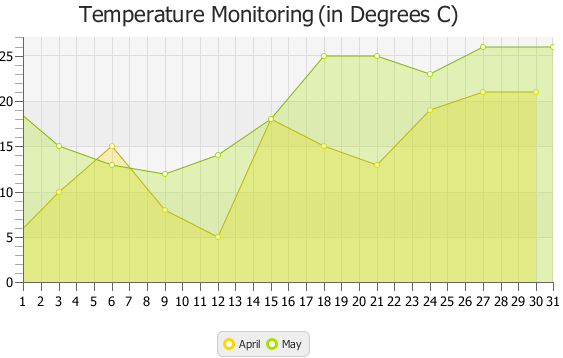
Description of "Figure 4-1 Typical Area Chart"
Creating an Area Chart
To create a simple area chart in your application, at minimum, you must define two axes, create the AreaChart object by instantiating the AreaChart class, create one or more series of data by using the XYChart.Series class, and assign the data to the chart.
When instantiating the AreaChart class, you can specify the observable list with a series of data within a constructor, or add the series later by calling the getData and addAll methods on the AreaChart object.
Example 4-1 creates an area chart to illustrate temperature monitoring data. The example uses two series of data collected for the periods of April and May.
| Example 4-1 Creating an Area Chart
import javafx.application.Application;
import javafx.scene.Scene;
import javafx.scene.chart.AreaChart;
import javafx.scene.chart.NumberAxis;
import javafx.scene.chart.XYChart;
import javafx.stage.Stage;
public class AreaChartSample extends Application {
@Override public void start(Stage stage) {
stage.setTitle("Area Chart Sample");
final NumberAxis xAxis = new NumberAxis(1, 31, 1);
final NumberAxis yAxis = new NumberAxis();
final AreaChart<Number,Number> ac =
new AreaChart<Number,Number>(xAxis,yAxis);
ac.setTitle("Temperature Monitoring (in Degrees C)");
XYChart.Series seriesApril= new XYChart.Series();
seriesApril.setName("April");
seriesApril.getData().add(new XYChart.Data(1, 4));
seriesApril.getData().add(new XYChart.Data(3, 10));
seriesApril.getData().add(new XYChart.Data(6, 15));
seriesApril.getData().add(new XYChart.Data(9, 8));
seriesApril.getData().add(new XYChart.Data(12, 5));
seriesApril.getData().add(new XYChart.Data(15, 18));
seriesApril.getData().add(new XYChart.Data(18, 15));
seriesApril.getData().add(new XYChart.Data(21, 13));
seriesApril.getData().add(new XYChart.Data(24, 19));
seriesApril.getData().add(new XYChart.Data(27, 21));
seriesApril.getData().add(new XYChart.Data(30, 21));
XYChart.Series seriesMay = new XYChart.Series();
seriesMay.setName("May");
seriesMay.getData().add(new XYChart.Data(1, 20));
seriesMay.getData().add(new XYChart.Data(3, 15));
seriesMay.getData().add(new XYChart.Data(6, 13));
seriesMay.getData().add(new XYChart.Data(9, 12));
seriesMay.getData().add(new XYChart.Data(12, 14));
seriesMay.getData().add(new XYChart.Data(15, 18));
seriesMay.getData().add(new XYChart.Data(18, 25));
seriesMay.getData().add(new XYChart.Data(21, 25));
seriesMay.getData().add(new XYChart.Data(24, 23));
seriesMay.getData().add(new XYChart.Data(27, 26));
seriesMay.getData().add(new XYChart.Data(31, 26));
Scene scene = new Scene(ac,800,600);
ac.getData().addAll(seriesApril, seriesMay);
stage.setScene(scene);
stage.show();
}
public static void main(String[] args) {
launch(args);
}
}
|
This example creates two NumberAxis objects to present numerical data on horizontal and vertical axes. Values rendered on the horizontal axis (X) are retrieved from the first parameter of the XYChart.Data objects, whereas the second parameter provides data for the vertical axis (Y).
The series of data is assigned to the chart by using the getData and addAll methods. Because the seriesMay data is added last, the corresponding green area overlays the yellow area that shows April data.
The result of compiling and running the application, is shown in Figure 4-2.