| Price Per Cone
| Quantity Demanded
|
| $.50
| 190
|
| $.75
| 175
|
| $1.00
| 125
|
| $1.25
| 85
|
| $1.50
| 65
|
| $1.75
| 50
|
| $2.00
| 40
|
Why Demand Behaves the Way It Does. The survey results illustrate the law of demand in action. As you can see, the number of ice cream cones that students were ready, willing and able to buy was greater at the lowest prices than at the higher prices. Demand behaves the way it does for some of the following reasons.
Ø More people can afford to buy an item at a lower price than at a higher price.
Ø At a lower price some people will substitute ice cream cones for other items (such as candy bars or soft drinks), thereby increasing the demand.
Ø At a higher price some people will substitute other items for ice creams.
Ø How many ice cream cones can you eat? Some people will eat more than one if the price is low enough. Sooner or later, however, we reach the point where enjoyment decreases with every bite no matter how low the cost. What is true of ice cream applies to most everything. After a certain point is reached, the satisfaction derived from a good or service will begin to diminish. Economists describe this effect as diminishing marginal utility. “Utility” refers to the usefulness of something. Thus “diminishing marginal utility” is the economist’s way of describing the point reached when the last item consumed will be less satisfying than the one before.
Diminishing marginal utility helps to explain why lower prices are needed to increase the quantity demanded. Since your desire for a second cone is bound to be less than it was for the first, you are not likely to buy more than one, except at a lower price. At even lower prices you might be willing to buy additional cones and give them away.
The demand curve illustrates the demand for ice cream cones that day in April. It also enables us to estimate what the demand would be for those prices falling in between the prices we surveyed. Although the students were not questioned about how many cones they would buy if the selling price were $1.60, the curve lets us estimate the number would be about 55.
Demand for Ice Cream Cones Near Your School
Price per cone

0 25 50 75 100 125 150 175 200
Number of cones
Elasticity of Demand
The shape and slope of demand curves for different products are often quite different. If, for example, the price of a quarter of milk were to triple, from $.80 to $2.40 a quart, people would buy less milk. Similarly, if the price of all cola drinks were to jump from $1 to $3 a quart (an identical percent increase), people would buy less cola. But even though both prices changed by the same percentage, the decrease in milk sales would probably be far less than the decrease in cola sales. This is because people can do without cola more easily than they can do without milk. The quantity of milk purchased is less sensitive to changes in price than is the quantity of cola. Economists would explain this by saying that the demand for cola is more elastic than the demand for milk. Elasticity describes how much a change in price affects the quantity demanded.
How Elasticity is Measured. When the demand for an item is inelastic, a change in price will have a relatively small effect on the quantity demanded. When the demand for an item is elastic, a small change in price will have a relatively large effect on the quantity demanded.
Elasticity can also be measured by the "revenue test." Total revenue is equal to the price times the number of units sold. If, following a price increase, total revenue falls, the demand would be described as elastic. If total revenue were to increase following a price increase, the demand would be inelastic.
Similarly, if total revenue increased following a price decrease, demand would be elastic. If the price decrease led to a decrease in total revenue, the demand for the item would be described as inelastic.
Super Sally's Supermarket sells 500 quarts of milk and 100 quarts of cola daily. At $.80 a quart she grosses $400 on her milk sales, and at $1 a quart she grosses $100 on her cola. Last week she increased the prices of the milk and cola by 50 percent— milk sold for $1.20 a quart, and cola for $1.50. Following the price increases, milk sales slipped to 350 quarts daily, while soda sales dropped to 35 quarts.
Total revenue from the sale of milk increased (to $420) following the price increase because the demand for milk is inelastic. Total revenue from the sale of cola fell (to $52.50), and for that reason we can say that the demand for cola is elastic.

Why the Demand for Some Goods and Services Is Inelastic. The demand for some goods and services will be inelastic for one or more of the following reasons:
Ø They are necessities.
Ø It is difficult to find substitutes. Cola drinkers can switch to other soft drinks, but there are few substitutes for milk.
Ø They are relatively inexpensive. People are less apt to change their buying habits when the price of something that is relatively inexpensive is increased or decreased. If, for example, the price of an item were to double from 10 cents to 20 cents, it would have less of an effect on demand than if the price had gone from $250 to $500.
Ø It is difficult to delay a purchase. When your car is running out of gas, it is not always possible to shop for the best deal.
Changes in Demand. Until now, we have been describing the relationship between an item's price and the quantity of an item people will purchase. Sometimes things happen that change the demand for an item at each and every price. When this occurs, we have an increase or a decrease in demand.
What are some of the factors that would cause the demand for ice cream, or any other product, to increase or decrease at each and every price?
Substitutes. When two goods satisfy similar needs, they are described as substitutes. A change in the price of one item will result in a shift in the demand for a substitute. Black and brown shoes are close substitutes. If the price of black shoes goes up, then people will tend to substitute brown shoes for black shoes, and the demand curve for brown shoes will shift out at every price. If the price of black shoes goes down, then people will tend to substitute black shoes for brown shoes, and the demand curve for brown shoes will shift in at every price.
Complementary goods. Goods that are often consumed together, like peanut butter and jelly, are complements. If the price of peanut butter should increase, the quantity of peanut butter consumed will decrease. Since peanut butter and jelly are consumed together, the quantity of jelly demanded at each and every price will also decline, and the demand curve for jelly will shift in.
What are some other factors that might cause the demand for ice cream your friends are selling to increase or decrease at each and every price? How would these changes be reflected in the demand curve? The following is a brief list of factors that might affect the curve:
Ø Change in the environment. It is a much hotter month than usual.
Ø Change in the item’s usefulness. The Surgeon General of the United States issues a report that states ice cream is good for you and enhances your attractiveness.
Ø Change in income. Allowances are raised as an economic boom sweeps your community.
Ø Change in the price of a substitute product. The price of candy decreases.
Ø Change in the price or availability of complementary products.
Ø Change in styles, taste, habits, etc.
Price per Cone
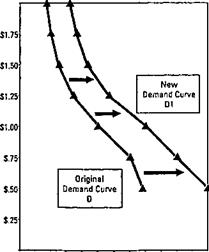
If any of these events occurred, the demand schedule would change
in such a way that the quantity demanded at any particular price
would be higher or lower than our original demand schedule
indicates. If the demand were to increase, the curve would shift
outward (Figure). If demand were to decrease, the curve would
shift inward.